Instantly Create Pie Charts with AI
Create a professional Pie Chart in seconds without code. Connect any data source and get insights with AI.
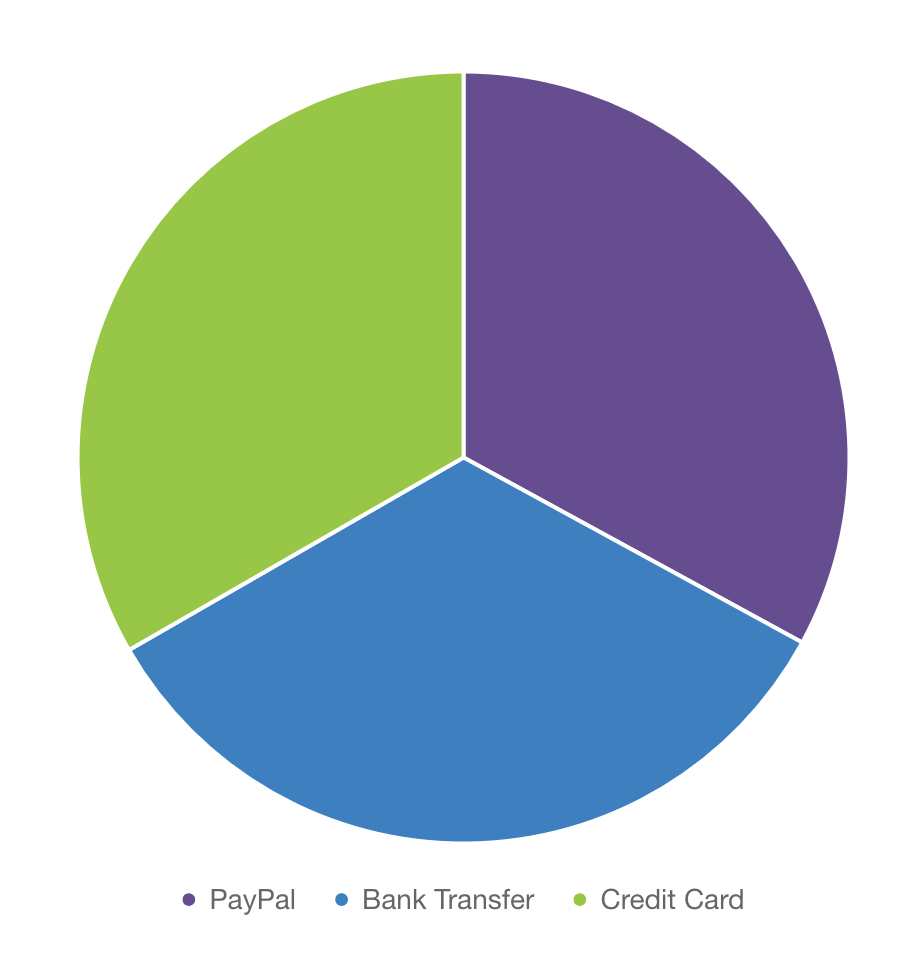
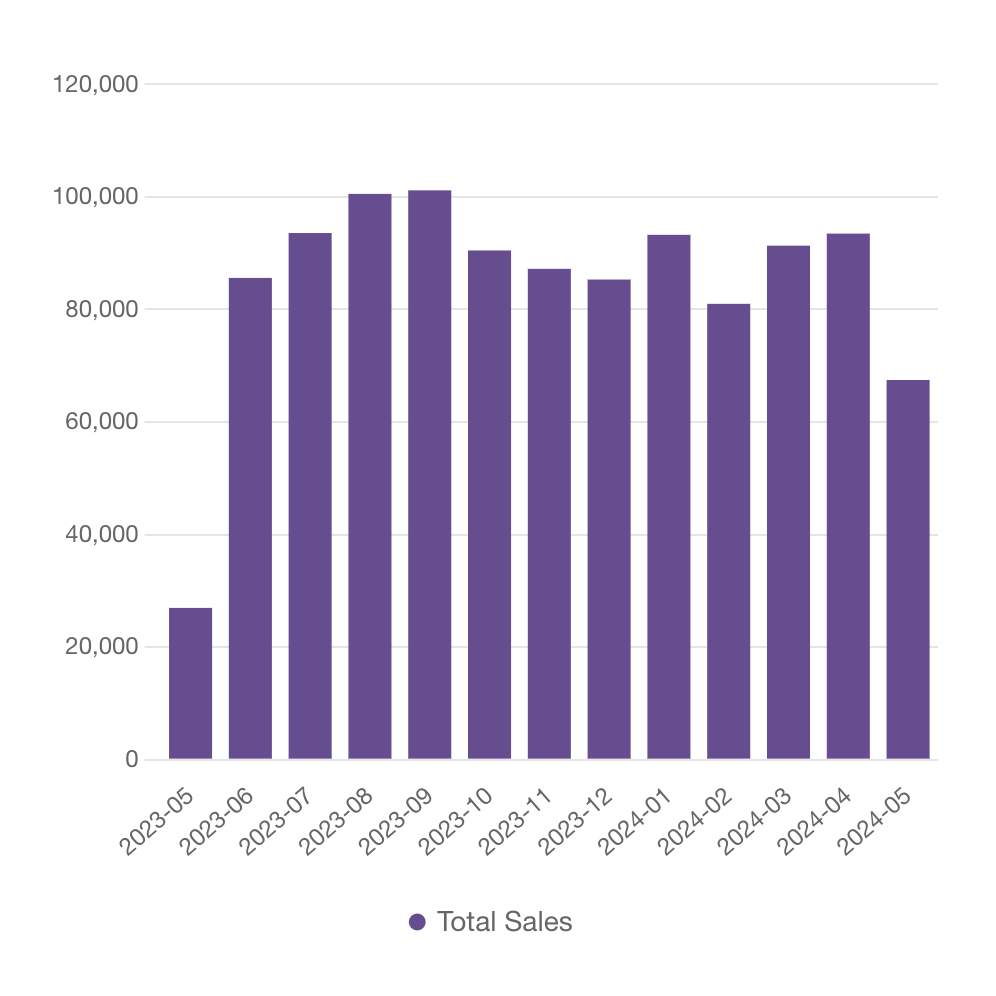
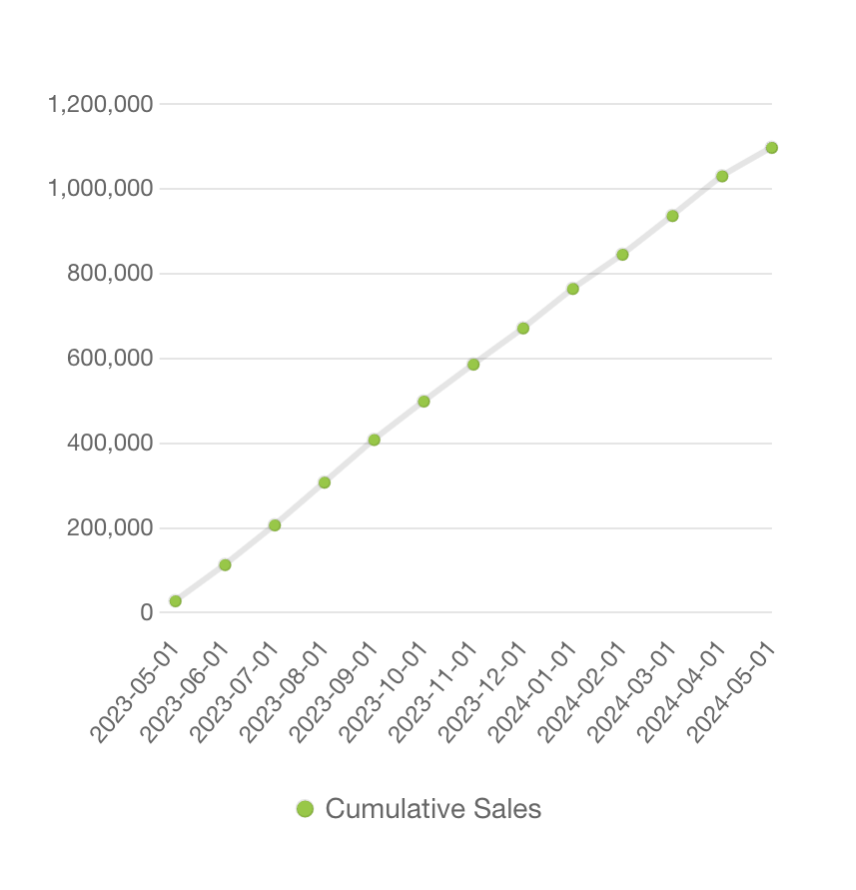
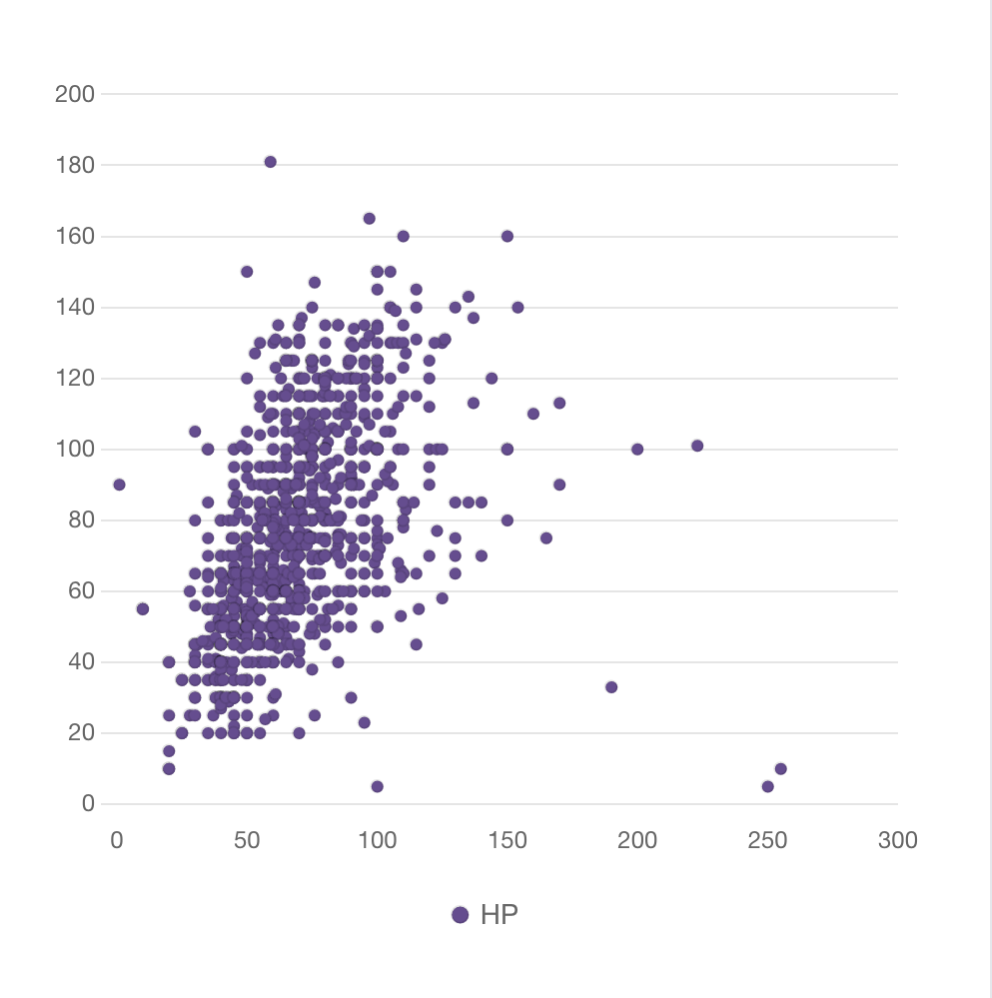
Sample data
Pie Chart
A pie chart is a circular statistical graphic that is divided into slices to illustrate numerical proportions.
It is useful for showing the proportion of each category in a dataset.
Create Beautiful Charts with AI
We support a variety of chart types. Create professional looking charts in seconds without code.