Instantly Create Line Charts with AI
Create a professional Line Graph in seconds without code. Connect any data source and get insights with AI.
Sample data
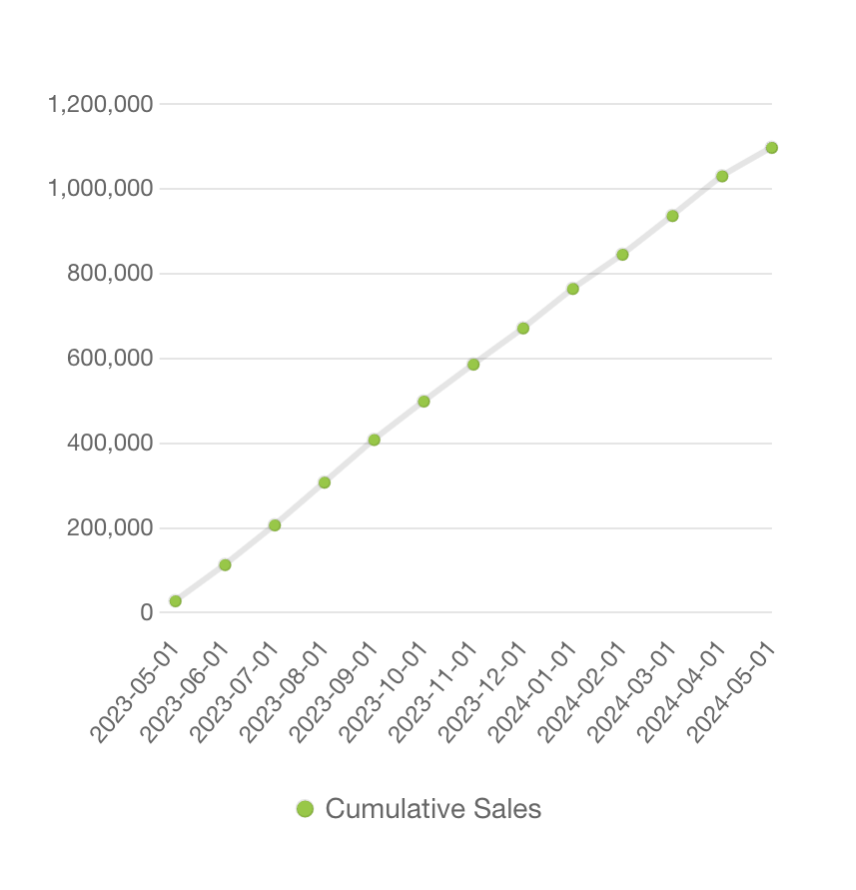
Line Graph
A line chart or line graph is a type of chart that displays information as a series of data points called markers connected by straight line segments.
It is useful for showing trends over time.
Create Beautiful Charts with AI
We support a variety of chart types. Create professional looking charts in seconds without code.